refine-demo

Open refine demo
(for more detail see Data Carpentry materials)
Open Refine (previously Google Refine) is an open-source tool that can help you to clean-up messy datasets. It presents itself as a spreadsheet-like interface, but all operations we do to the data are recorded and can be repeated or reversed. We will show how it can be used to solve some of the issues we have highlighted previously. You can use Open Refine to build-up a data-cleaning pipeline which you can apply to multiple files. We will not go that far today though. There are some nice introductory videos
Open Refine runs in a web browser, although you do not have to be online to use it.
Downloading and installation
OpenRefine 2.8 can be downloaded and installed for various operating systems
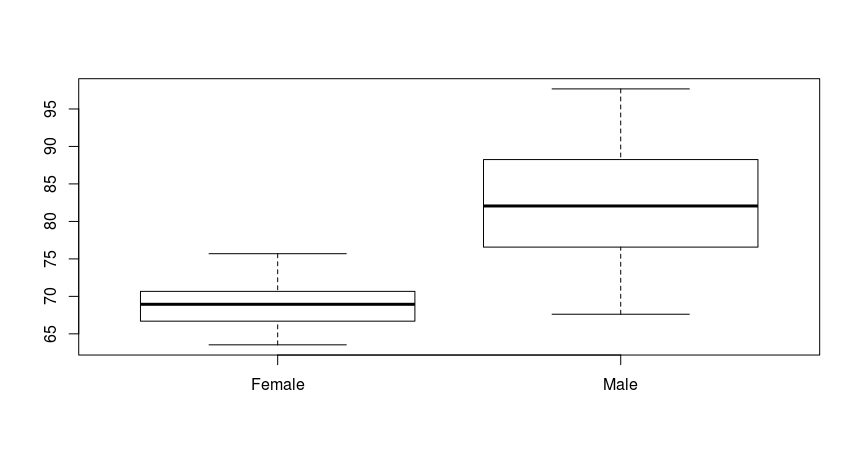
Some example data
We will use some data that have been simulated to demonstrate many of the problems we have seen already. Each row represents a different patient in a fictitious study and can be downloaded from the course website. (Right-click and Save Link as....)
Importing the data
Start the program. On Windows, Double-click on the openrefine.exe file. Java services will start on your machine, and Refine will open in your Firefox browser. On the Mac, you’ve probably installed the package into your Applications folder.
Note the file types Open Refine handles: TSV, CSV, *SV, Excel (.xls .xlsx), JSON, XML, RDF as XML, Google Data documents. Support for other formats can be added with Google Refine extensions.
Once Refine is open, you’ll be asked if you want to Create, Open, or Import a Project.
- Click Browse, find
patient-data.csv - Click next to open
patient-data.csvRefine gives you a preview - a chance to show you it understood the file. If, for example, your file was really comma-separated, the preview might look strange, you would choose the correct separator in the box shown and click “update preview.” - You should see something like…
If all looks well, click Create Project.
Faceting
Faceting provides you a snapshot of the entries in a particular column and allows you to filter down to particular rows. It can also quickly highlight problems with the data.
Typically, you create a facet on a particular column. The facet summarizes the cells in that column to give you a big picture on that column, and allows you to filter to some subset of rows for which their cells in that column satisfy some constraint. That’s a bit abstract, so let’s jump into some examples. Before we start, how many different entries would we expect to find a column that is supposed to denote whether somebody smokes or not`?
- Scroll over to the
Smokescolumn - Click the down arrow and choose Facet -> Text facet
- In the left margin, you’ll see a box containing every unique, distinct value in the
Smokescolumn and Refine shows you how many times that value occurs in the column (a count), and allows you to sort (order) your facets by name or count.
In this case, we have found many different ways for the smoking status to be recorded.
Edit. Note that at any time, in any cell of the Facet box, or data cell in the Refine window, you have access to edit and can fix an error immediately. Refine will even ask you if you’d like to make that same correction to every value it finds like that one (or not).
Trimming whitespace
Whitespace is when we have a blank space at the beginning, or end, of a text entry. They can be difficult to spot by-eye and for the computer Yes and Yes are completely distinct entries. This can have undesired consequences in a data analysis.
Fortunately, Open Refine has a straightforward solution to this problem
- Select the
Smokescolumn - Select Edit cells
- Common transforms -> Trim trailing and leading whitespace
Clustering
Staying with the Smokes column, there is also an inconsistent way of representing missing data; with Yes or TRUE used. Languages such as R would prefer TRUE to be used, although in practice we can use any as long as we are consistent.
- Click on
Noin the Facet panel. Only rows where the value ofSmokesisNowill be shown. - Click on the edit box
Novalue in any particular row. This will give you the chance to edit the value. - Change the value to
FALSE. Clicking Apply to all identical cells will change all occurences ofNotoFALSE. - You could also try changing
YestoTRUE…
Splitting into several columns
Sometimes multiple pieces of information can be encoded in a single cell. In our particular case, the ID assigned to each patient contains a hospital identifier (either AH or SG) and a numeric ID. For some analyses we might want to quickly perform operations that take the hospital as a factor
- Select the
IDcolumn - Edit column -> Split into several columns
- It will ask you what text character splits the IDs into different parts. In this case we specify
/ - Each new column is assigned a new name automatically. You can change the names by Edit column -> Rename this column
Filling missing values
The final column Date entered study was used to indicate the date at which each patient was enrolled onto the study in question. Patients were enrolled in batches. However, the person filling out the form thought it was helpful to include this information only once for each batch of new patients.
- Select the
Date Entered Studycolumn - Select Edit cells -> Fill down
- Empty cells will now be filled with the appropriate date.
Upper- and lower-case transformations
For consistency, we might want the text entries in a particular column to be all lower or UPPPER case.
- Select the
Namecolumn - Edit column -> Common transformations
- You can choose
To uppercase,To lowercaseif required. - However, we will use the operation
To titlecase. It makes the first letter of the text Upper case, but the rest of the text Lower case.
More-advanced text operations
Open Refine has it’s own language (“General Refine Expression language (GREL)”) for performing custom text operations in a column.
The Height and Weight columns are problematic because they contain the units information (kg and cm respectively). Languages such as R will interpret the values in such a column as text, and not numeric data. Simple plotting and numeric analysis will not be possible without extra manipulation.
- Select the
Heightcolumn - Select Edit cells -> Transform…
- In the Expression box, enter
replace(value, "cm","")
Things to try
- Can you split the
Birthcolumn into Year, Month and Day? - Tidy up the
Weightcolumn for analysis - The
Racecolumn contains one value that is very suspicious…Can you find it and change it to something suitable? - Look at the
Statecolumn and try faceting / clustering?. Are there any entries that should be joined into one? You may need to experiment with different clustering methods.
Exporting your data / project
You can export the modified table into a new file:-
- Export -> Tab-separated value or Export -> Comma-separated value would seem to be sensible choices.
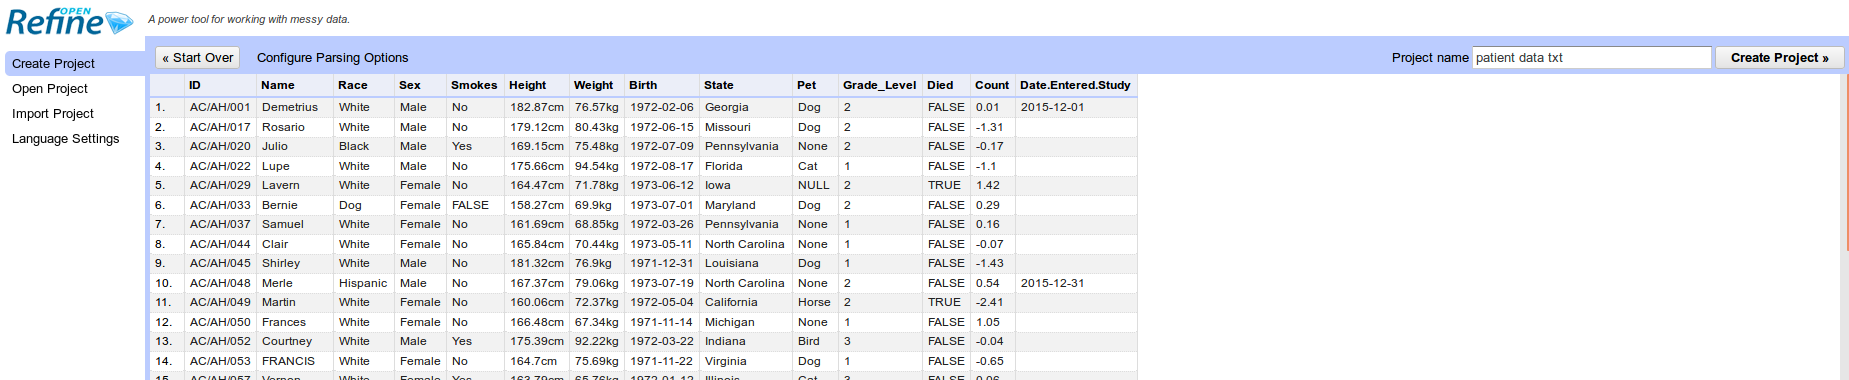
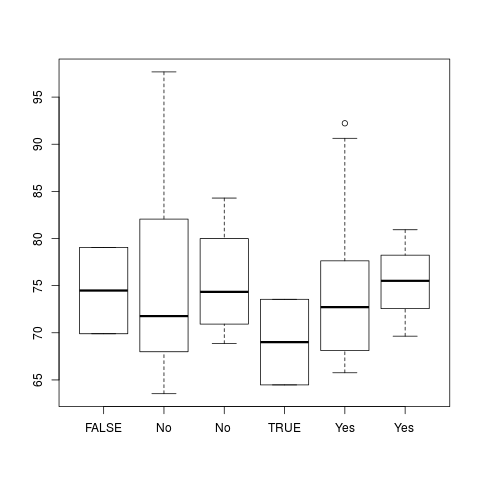
Impact on analysis
Lets suppose we want to look at the difference in weight between males and females in the study. Which set of R commands looks more straightforward?
After cleaning
patients <- read.delim("patient-data-cleaned.tsv")
boxplot(patients$Weight ~patients$Smokes)
Before cleaning
library(stringr)
patients <- read.delim("patient-data.txt")
patients$Weight <- as.numeric(str_replace_all(patients$Weight, "kg",""))
patients$Smokes <- str_trim(patients$Smokes)
patients$Smokes <- gsub("Yes","TRUE",patients$Smokes)
patients$Smokes <- as.logical(gsub("No","FALSE",patients$Smokes))

boxplot(patients$Weight ~patients$Smokes)